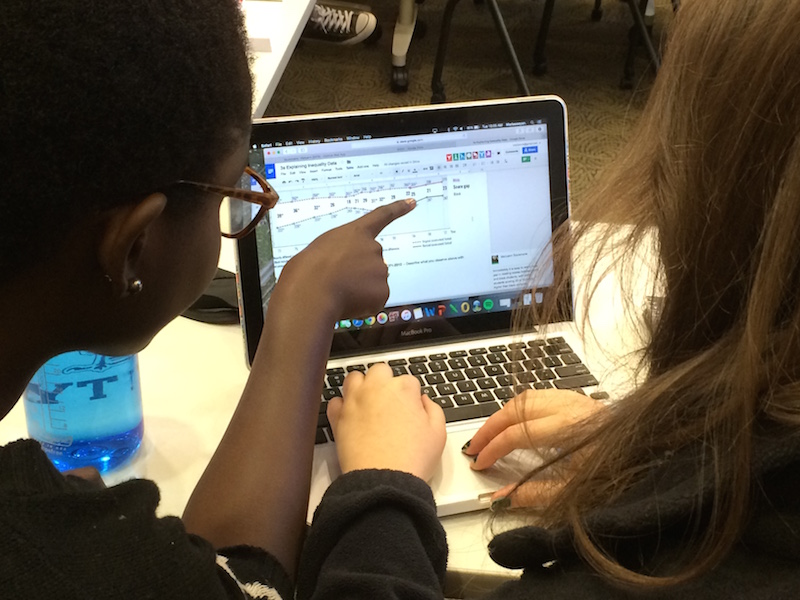
 Pairs of students commented on inequality data patterns in a shared Google Document
Pairs of students commented on inequality data patterns in a shared Google Document
Today I updated a data exercise for my introductory Educ 200: Analyzing Schools course at Trinity College, and designed it so that others may easily adapt the lesson and materials for other settings. The goal was to prepare my undergraduate students for our next unit on educational inequalities, where we will compare and contrast eight different theoretical explanations for differences in learning outcomes. To springboard us into this unit, I compiled a Google Document with charts on standardized test scores by ethnicity, family income, parental education, and gender. The exercise draws on data from the SAT (very familiar to my students, though not statistically representative) and the NAEP long-term trends (the “gold standard” for educational researchers, though most of my students had never heard of it until today). After introducing the exercise and cautioning the class about standardized test data, pairs of students dug into these parts of the exercise:
Part 1: What are key differences between tests such as the SAT versus NAEP?
Part 2: Describe what you observe in each of the data tables.
Part 3: List different types of plausible reasons that might explain the causes of the data patterns above.
Part 4: Together, we will create broad categories, and sort explanations into related groups.
Students were highly engaged in this activity. Some were surprised to find strong relationships (such as family income), or puzzled about patterns that varied across tests (the math gender gap was less pronounced in the NAEP versus the SAT). We concluded the exercise by sorting some of their plausible explanations into three categories: in-school, out-of-school, and in-between factors. More questions were raised than answered in this exercise, but that’s why it’s an excellent springboard into this inequality unit.
This year I updated the charts (thanks to helpful data published by the Hartford Courant and the National Center for Educational Statistics), and placed all of this in a Google Document where my students could share their insights as “suggestions” or “comments” without altering the original content. Another advantage is that the Google Doc format allows me to easily share this template on the public web, where others may make their own copy and modify as they wish.