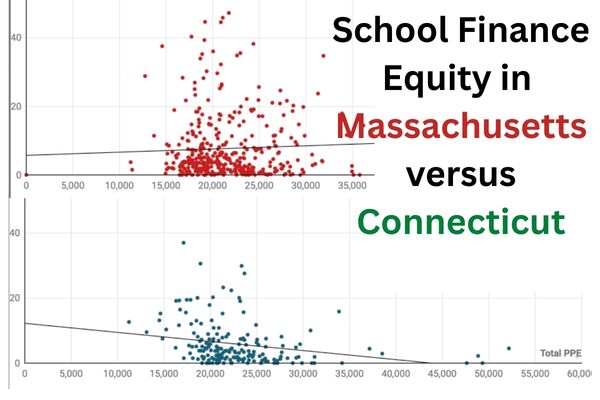
Comparing School Finance Equity in MA vs CT
Our partners at the School + State Finance Project asked my Trinity College students in Fall 2025 to create data visualizations to compare school finance equity between Connecticut and Massachusetts. My students created data stories with interactive charts and maps to answer questions such as: How does school spending per student vary across states when factoring in different costs of living? Do CT and MA school districts have equitable spending based on the racial background or multi-language learner status of students? On the latter question, Trinity students Rachel Fearon and Ashley Nelson found that MA districts have a slightly positive trend of spending on higher percentages of multi-language learners, while CT districts have a slightly negative trend in the opposite direction, as shown in the comparative scatter charts below.