AERA 2019 presentation: How Can Data Visualization Improve our Communication of Educational Research?
Judith Kafka and Janelle Scott invited me and other panelists to participate in a Presidential Session on Data Visualization at the American Educational Research Association meeting in Toronto, to respond to these questions:
- What kinds of questions are being asked and answered through data visualization?
- What gets left out?
- What are the uses for data visualization and what are its limits?
My response drew on lessons learned from working on two books-in-progress: On The Line and Data Visualization for All. Here’s a summary of my argument, which I plan to integrate into the latter book:
Data visualizations allow educational researchers to illustrate evidence in at least three dimensions:
- Numerical values
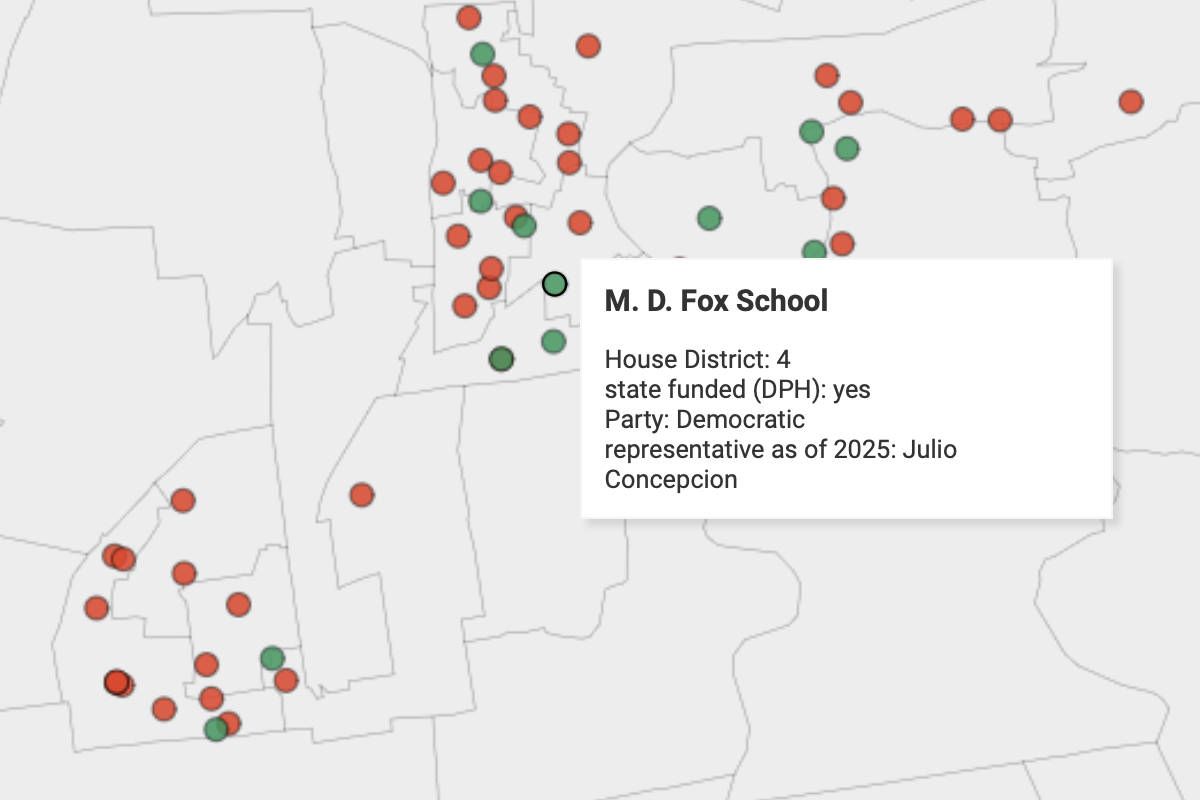
- Spatial relationships
- Change over time Interactive visualizations on the web can combine dimensions and engage audiences to ask more questions about the data. But they raise rich questions (such as intent and agency) that may not easily be shown through data visualizations.
And here’s the visualized version of that argument in Google Slides: